
A fleet manager shopping for a commercial truck in 2026 is not comparing sticker prices. They are building a cost model before they make the first call to a dealer. Operating costs have climbed to $2.34 per mile on average — a 45% increase since 2020 — and the buyers carrying those numbers into their research are evaluating inventory through a completely different lens than a retail customer would. The sticker price of a $180,000 Class 8 tractor is roughly 15% of the five-year total cost of ownership. The other 85% is what fleet managers are trying to figure out before they talk to you.
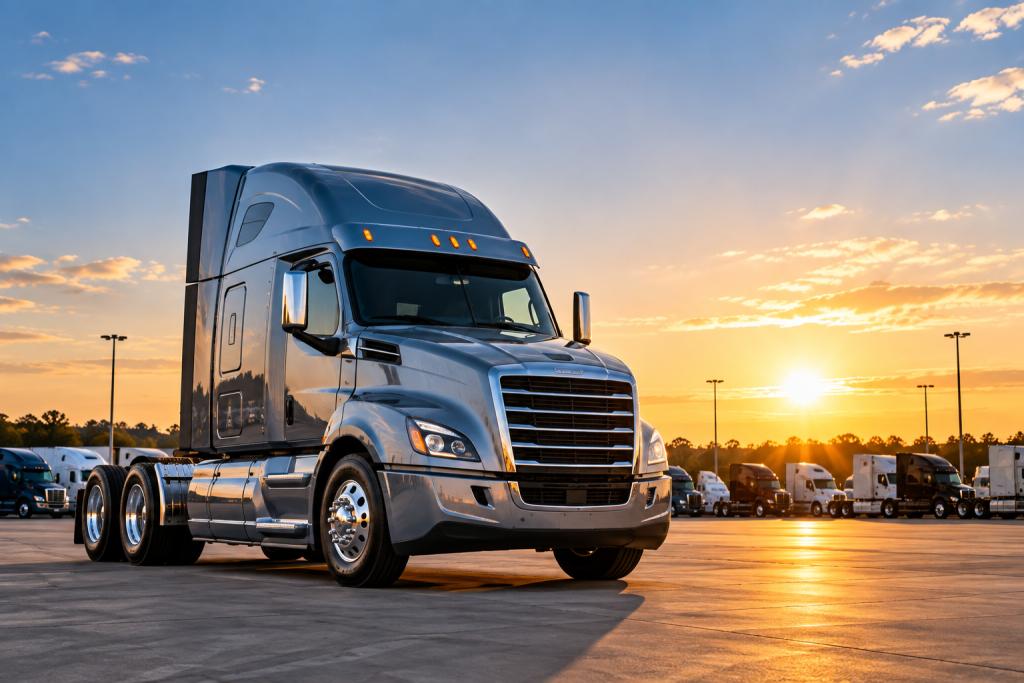
The dealers who understand this are building listings and content that speaks to that calculation. The ones who do not are giving buyers no reason to contact them over a competitor who does.
The purchase price of a commercial truck accounts for roughly 15% of five-year total cost of ownership. Fleet buyers are evaluating the other 85% before they pick up the phone.
What Fleet Buyers Are Actually Calculating Before They Contact a Dealer
Total cost of ownership for a commercial truck is not a single number — it is a weighted model across six expense categories. According to ATRI’s 2025 operational cost data, the breakdown for a Class 8 truck looks like this: driver compensation accounts for 44% of total costs, fuel and DEF for 22%, truck and trailer payments for 15%, repair and maintenance for 10%, insurance for 7%, and tires, tolls, permits, and miscellaneous for the remaining 2%. (Source: Fleet Owner — ATRI Trucking Operating Costs 2025)
When a fleet manager evaluates a specific unit online, they are trying to estimate what the categories they can control are going to cost them. The driver compensation line is fixed. The truck payment is visible in the listing price. What they cannot see from a standard listing — but are actively looking for — is what the repair and maintenance trajectory looks like on that unit, what the fuel consumption data shows, and how the unit’s resale value will hold up relative to what they are paying today.
That information is what separates a listing a fleet manager closes a tab on from one they call about. Not because they found a lower price — because one listing gave them enough to run the math and the other one did not.
The Cost Categories Rising Fastest in 2026
Repair and maintenance led all cost category increases in 2025 at 8.6%, reaching $0.22 per mile — the highest rate of growth of any operating expense. Insurance premiums jumped 6.4% in Q1 2026. Toll costs climbed 13.2% in the same period, particularly hitting fleet operations across the Northeast. The average distance between roadside breakdowns fell from 38,249 miles in 2024 to 36,891 miles in 2025 — meaning equipment reliability is declining across the board as average fleet age climbs. (Source: Millennials Maintenance — Fleet Maintenance Statistics 2026)
For a fleet manager evaluating two similar used units at similar prices, the one with documented preventive maintenance history represents a meaningfully lower risk profile. The repair and maintenance cost per mile for small fleets under five trucks averages $0.275 per mile — 63% higher than what large fleets with over 1,000 trucks pay at $0.169 per mile. That gap is largely explained by reactive versus planned maintenance patterns. A unit with a complete service record is evidence of planned maintenance. Without documentation, a buyer has to price in the worst-case scenario.
Reactive repairs cost three to nine times more than the same work done as planned maintenance. A commercial truck listing with complete service documentation removes that risk premium from the buyer’s mental model — before the first conversation.
The Documentation Gap That Costs Dealers Inquiries
Industry data shows that commercial vehicles with complete, verifiable service documentation command a 10 to 20% price premium over comparable units without records. That premium exists because of paperwork, not mechanical condition. Two trucks with the same engine hours, the same mileage, the same model year — one with a documented maintenance history and one without — are priced differently in the market because the undocumented unit carries unquantifiable risk. (Source: Heavy Vehicle Inspection — Fleet Resale Value and Maintenance Records)
What this means for dealer listings is direct: a listing without service history is not a neutral data point. It is a signal to a fleet buyer that a cost they cannot estimate is waiting for them. Fleet managers who prioritize knowing a repair is needed before a breakdown or accident — 43% of surveyed fleet managers named this as their top operational priority — are not going to call a dealer whose listing gives them nothing to work with on that question.
The dealers who are capturing fleet inquiries at a higher rate are the ones whose listings include specific, verifiable details: maintenance intervals completed, major component replacement dates, inspection records, mileage consistency across service events. Not summaries. Not ‘well maintained.’ Specific dates, specific work, specific components.
A complete history available in digital form also matters to buyers on a timeline. A fleet manager who can verify maintenance history in seconds during an active comparison session is more likely to move forward than one who has to wait two days for a service department to pull paper records. Speed of verification is part of the credibility equation.
Downtime Is the Number Fleet Buyers Are Really Worried About
Unplanned downtime costs the average commercial fleet approximately $825 per vehicle per day in 2026. A single unexpected breakdown that sidelines a truck for four days absorbs $3,300 in downtime cost on top of the repair bill itself. Fleet managers evaluating used inventory are not just thinking about purchase price — they are thinking about the probability of that $3,300 event in the first 12 months of ownership. (Source: Alliance Fleet Solutions — Fleet Lifecycle Management 2026)
This changes how fleet buyers read a listing. A unit listed at a $4,000 discount from market comp but with no service documentation is not obviously a better deal. It may represent a higher expected downtime cost than a unit at full asking price with verified maintenance history. The buyer is doing that math before they call. The listing that helps them do the math — with actual documentation rather than a price cut — is the listing that earns the inquiry.
For dealers, this is an argument for investing in listing quality before adjusting price. A unit whose listing documents oil change intervals, brake service dates, and major drivetrain work communicates something a price reduction cannot: that the previous operator took care of it. That credibility is worth more to a fleet buyer managing a $825-per-day downtime risk than a $2,000 price concession.
A $4,000 price cut on an undocumented unit does not offset an $825 per day downtime risk in a fleet manager’s calculation. Documentation removes the risk. Price cuts acknowledge it.
How Depreciation Enters the Online Evaluation Process
Class 8 trucks lose approximately 18% of their value in the first 12 months of ownership. Fleet managers with a structured replacement cycle — typically 36 to 60 months — are evaluating a used unit not just on purchase cost but on where it sits in that depreciation curve and what resale value it will carry when they cycle it out. A used truck that is well-documented, well-maintained, and competitively priced relative to current market comps has a more predictable depreciation path than one with gaps in its history. Average resale values for commercial vehicles in early 2026 were approximately $38,685 — but that number moves significantly based on condition documentation and spec completeness. (Source: Alliance Fleet Solutions — Commercial Truck Lease Guide 2026)
Dealers who provide detailed spec information — not just the basics but axle configuration, wheelbase, body spec, PTO capability, upfit details, and GVWR — are giving fleet managers everything they need to assess fit for their application and resale applicability in their market. A listing that answers those spec questions without requiring a phone call moves faster because it removes one full research step from the buyer’s process.
What the Fuel Line Means for a Fleet Buyer Reading Your Listing
Fuel accounts for 22% of commercial trucking operating costs — the second-largest expense category after driver compensation. At $2.34 per mile in total operating costs, fuel alone represents approximately $0.515 per mile. For a fleet running a unit at 100,000 miles per year, a 1 mpg improvement in fuel economy saves roughly $4,000 to $6,000 annually depending on diesel prices in their region. That is a number fleet buyers can calculate and compare across listings. (Source: Heavy Vehicle Inspection — Truck TCO Guide 2026)
Dealers who include documented fuel economy data — from telematics exports, fleet management software records, or manufacturer spec sheets for specific configurations — are giving fleet buyers a direct input for their cost model. Telematics data showing fuel consumption optimization has been shown to reduce fleet fuel costs by up to 14% compared to unoptimized operations. A fleet buyer who can see actual fuel economy from the unit’s operating history, not just the manufacturer estimate for the model, is looking at real data that maps to their own operating cost projections.
Most dealer listings do not include this. The ones that do stand out immediately to fleet managers who are running the numbers.
The Online Research Step Dealers Are Missing
65% of commercial vehicle buyers report they would complete some or most of the purchase process online if the information were available to them. 25% are now using AI tools during their research — querying platforms like ChatGPT or Google AI Overviews for specific unit comparisons, cost breakdowns, and dealer reputation signals. (Source: Demand Local — Digital Retailing and Online Car Buying Statistics 2026)
The research step that is happening before a fleet buyer contacts a dealer is not just a price check. It is a TCO pre-screening. Fleet managers are arriving at listings with an operating cost framework already built. They are looking for listings that give them enough information to fit a unit into that framework — or move on to the next one.
The gap between what most dealer listings provide and what fleet buyers need to complete that pre-screening is where inquiries are lost. A buyer who cannot answer their core cost questions from your listing is not going to call to ask — they are going to find a listing that answers them. Dealers who close that gap at the listing level are the ones getting called.
What Fleet-Ready Listings Include That Most Dealer Listings Do Not
- Documented maintenance history with specific dates and service events — not a general condition statement
- Fuel economy data from actual operation, not manufacturer estimates for the model class
- Major component status — engine hours, transmission service, brake condition, tire tread depth
- Upfit specifications with installation dates and any modifications to factory configuration
- Resale comparables or replacement cost context to help buyers validate pricing against current market
30.8% of fleets still track maintenance on spreadsheets. For dealers who do have digital maintenance records on their inventory, making that documentation visible and accessible in the listing is a direct competitive advantage over dealers who do not — because the buyer’s first question is already answered before the conversation starts.
Are Your Listings Speaking to the Buyers Running the Numbers?
Fleet managers evaluating commercial inventory in 2026 are doing so with $2.34 per mile in operating costs, $825 per day in downtime exposure, and an 8.6% annual increase in repair costs already in the back of their heads. The listing that helps them answer those questions before a phone call is the listing that earns their time. The one that does not is one they close.
Book a 15-Minute Call with our team. We will look at how your current inventory listings are positioned for fleet buyers specifically — what cost and documentation signals they are sending, where the gaps are, and what changes to listing structure and content typically move units to this buyer type faster. No pitch, no obligation — just a clear look at what fleet buyers see when they find your inventory.
Email us directly: info@buzznerd.com
Sources
Fleet Owner — ATRI Operational Costs of Trucking 2025
Heavy Vehicle Inspection — Truck Total Cost of Ownership Guide 2026
Heavy Vehicle Inspection — Fleet Resale Value and Maintenance Records
Millennials Maintenance — Fleet Maintenance Statistics 2026
Alliance Fleet Solutions — Strategic Fleet Lifecycle Management 2026
Alliance Fleet Solutions — Commercial Truck Lease Guide 2026
My Equipment — 2026 Fleet Manager’s Guide to Used Equipment Procurement
Demand Local — Digital Retailing and Online Buying Statistics 2026
FAQ
Question: What is total cost of ownership for a commercial truck?
Answer: Total cost of ownership for a commercial Class 8 truck covers all costs over the vehicle’s operational life, not just the purchase price. The six major categories are driver compensation (44% of costs), fuel and DEF (22%), truck and trailer payments (15%), repair and maintenance (10%), insurance (7%), and tires, tolls, and miscellaneous (2%). The sticker price on a $180,000 Class 8 tractor represents approximately 15% of the five-year total cost of ownership. Fleet buyers evaluate all six categories when making a purchase decision, not just the acquisition cost.
Question: Why do fleet buyers need maintenance documentation before buying a commercial truck?
Answer: Fleet buyers use maintenance documentation to estimate future repair and downtime costs, which are among the most variable and impactful operating expenses. Unplanned downtime costs the average fleet $825 per vehicle per day in 2026. Reactive repairs cost three to nine times more than the same work done as planned maintenance. A unit with complete, verifiable service history removes the need for a buyer to price in worst-case repair scenarios. Industry data shows fully documented units command a 10 to 20% price premium over comparable units without records — a gap that exists purely because of documentation, not mechanical condition.
Question: How much are commercial truck operating costs per mile in 2026?
Answer: Total Class 8 commercial truck operating costs averaged $2.34 per mile in 2025, up 45% since 2020. Excluding fuel, costs reached $1.85 per mile. The fastest-rising category in 2025 was repair and maintenance at 8.6% growth, reaching $0.22 per mile. Insurance premiums increased 6.4% in Q1 2026. Toll costs jumped 13.2% in the same period. Small fleets under five trucks pay significantly more for maintenance — $0.275 per mile versus $0.169 per mile for large fleets — largely due to reactive rather than planned maintenance patterns.
Question: What information do fleet buyers look for in a commercial truck listing online?
Answer: Fleet buyers evaluating commercial inventory online are looking for information that feeds their total cost of ownership calculation. That includes documented maintenance history with specific service dates and events, fuel economy data from actual operation rather than manufacturer estimates, major component status including engine hours, transmission service history, brake condition, and tire depth, upfit specifications and modification details, and pricing context relative to current market comparables. Most dealer listings do not include this level of detail. Listings that do stand out to fleet managers who are running cost models before making first contact with a dealer.
Question: How does downtime risk affect how fleet buyers evaluate used commercial inventory?
Answer: Unplanned downtime costs commercial fleets approximately $825 per vehicle per day in 2026. A single unexpected breakdown that takes a truck off the road for four days costs $3,300 in downtime alone, before the repair bill. Fleet managers evaluating used inventory weigh this risk directly against price and documentation. A unit listed at a discount without service history may represent a higher expected total cost than a fully documented unit at asking price. Dealers who include verifiable maintenance history in their listings remove that downtime risk premium from the buyer’s evaluation — which often matters more to a fleet manager’s decision than a price concession.